![]()
Iometer – IO Benchmark and Troubleshooting Tool
When I started work as an IT professional I remember chasing my tail quite frequently. I would click and click until I was blue in the face. When that didn’t work I would venture out into the jungle that was internet. Of course these trips were perilous and infrequently yielded results worth the effort. The early days of internet were not exactly known for their efficient search engines. Learning how to travel down the road of effective troubleshooting can be a journey in and of itself. So that brings us back to the old adage, “Use the right tool for the right job.” One of these tools I have come to love is Iometer. On initial download and install it appears confusing and clunky to the eager user, but with the right guide this can be a trip of wonderment and intrigue.
Download and Install
The latest release of Iometer can be downloaded from iometer.org. Version 2006.07.27 is the latest non-beta release. A newer beta release can be obtained from sourceforge.net. If you want to download the manual, pop some popcorn and kick off your finest Mozart tunes. It’s a tad lengthy and a bit dry but very informative. Once you get Iometer installed on your system, fire it up. You will notice a DOS command window spawning separately. Note: If you are running Windows Vista or Windows 7 be aware you will be required to run Iometer as “Administrator”. The background window is the Dynamo process executed independent of the Iometer GUI process.
Iometer is the controlling program. Using Iometer’s graphical user interface, you configure the workload, set operating parameters, and start and stop tests. Iometer tells Dynamo what to do, collects the resulting data, and summarizes the results in output files. Only one copy of Iometer should be running at a time; it is typically run on the server machine.
Dynamo is the workload generator. It has no user interface. At Iometer’s command, Dynamo performs I/O operations and records performance information, then returns the data to Iometer. There can be more than one copy of Dynamo running at a time; typically one copy runs on the server machine and one additional copy runs on each client machine.
Topology Panel
When Iometer starts up you should see the “Topology” panel on the left listing your host as a manager. Iometer should automatically create a worker (thread) for every CPU (core) on your system. If for some reason it fails to create any workers under the manager, make sure you started Iometer as “Administrator”. Otherwise create a worker manually by selecting your manager (hostname), and clicking on the “Start a new disk worker…” icon. For our walkthough we will only be testing against one worker. Select your newly created or preexisting worker and proceed to the next step.
Disk Targets
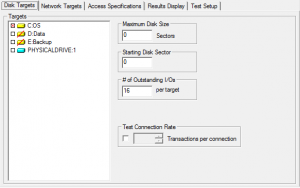
Select the physical disk where you wish to perform the IO testing. You will notice a red line striking through the disk icon. This indicates a missing test file, so Iometer will automatically create the file on first run. Consider the amount of RAM in use on your system. It is recommended you create the largest possible file for testing to avoid caching your Iometer test file in RAM. I try to keep my memory at 10% of the Iometer test file. I have 8GB of RAM so I would create an 80GB file. To accomplish this you multiply 80 * 1024 * 1024 * 1024 \ 512. That gives us 167,772,160 sectors, or 80GB. One sector is 512 K. The full calculation is 80GB * 1024 = 81,920 MB * 1024 = 83,886,080 KB * 1024 = 85,899,345,920K / 512 K = 167,772,160 sectors. I know, I’m over-complicating it. Just multiply the size of the test file (in GB) * 2,097,152 to get the number of sectors for Iometer. Start “# of Outstanding I/Os” at 1 for now.
Access Specifications
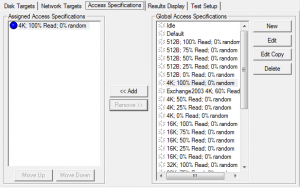
Here you assign a series of targeted tests that get executed in sequential order under the “Assigned Access Specifications” panel. You have quite a bit of freedom and flexibility here to pull from preexisting IO scenarios or define your own custom access pattern. For this lesson we will just assign the “4K; 100% Read; 0% Random” specification by selecting it and clicking the “Add” button. This scenario is self-explanatory, and is generally useful for generating a tremendous amount of IO since your read pattern is optimal and the blocks are small.
Results Display
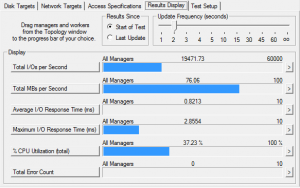
Moving along, we arrive at the “Results Display” tab. The purpose of this tab is to display your test results real-time once the test is executed. I leave the radio button for “Results Since” set to “Start of Test” as it averages the results as they roll in. I set “Update Frequency” to 2 or 3 seconds. Be careful about setting it too low as it is possible to affect the test negatively if it is borrowing CPU cycles to keep Iometer updated. While running you will see activity in the “Display” panel at the frequency you set. The three most important indicators are “Total I/Os per Second”, “Total MBs per Second”, and “Average I/O Response Time (ms)”. Total I/Os indicate the current number of operations occurring against your storage target. MBs per Second is a function of <I/Os> * <block size>. This indicates the amount of data your storage target is reading per second. One thing is for certain, that you don’t want to see any errors. You have another serious issue if that is what you are seeing.
Test Setup
The “Test Description” is used as an identifier in the output report if you select that option. “Run Time” is something you can play with. There are no strict rules regulating this setting. Generally speaking, the longer you run your test the more accurate your results. You system is expected to hicup, slow start, incur external requests and things of that sort. So extending your test a bit will level those bumps out. If it is a production test run it for 20 – 60 minutes. “Ramp Up Time” is a useful setting as it allows the disks to spin up and level out the internal cache for a more consistent test result. Set this between 10 seconds and 1 minute. “Record Results” is used when you would like to produce a test report following the test. Set it to “None” if you only wish to view the real-time results. You can accept the defaults for “Number of Workers to Spawn Automatically”. “Cycling Options” gives one the choice to increment Workers, Targets, and Outstanding I/Os while testing. This is useful in situations where you are uncertain how multiple CPU threads, multiple storage targets, and queue depth effect outcome. I encourage you to experiment with these parameters, especially the Outstanding I/Os (Queue Depth). Sometimes this is OS dependent and other times it is hardware related. Remember you can set the “Outstanding I/Os” under the “Disk Targets” tab. For this lesson we are going to take the default.
Test Run
Moving back to the “Results Display” tab, ensure you are not running any unnecessary applications or background jobs that may be consuming disk I/O. If you are running Windows Vista/7 you can pull up the “Resource Manager” (Task Manager -> Performance Tab -> Resource Monitor button) and view disk activity to validate the timing of your test run. Now that everything is ready, click the Green Flag button at the top to start the test. Following the Ramp Up time (indicated in the status bar) you will begin to see disk activity. Enjoy!
Video Walkthrough


